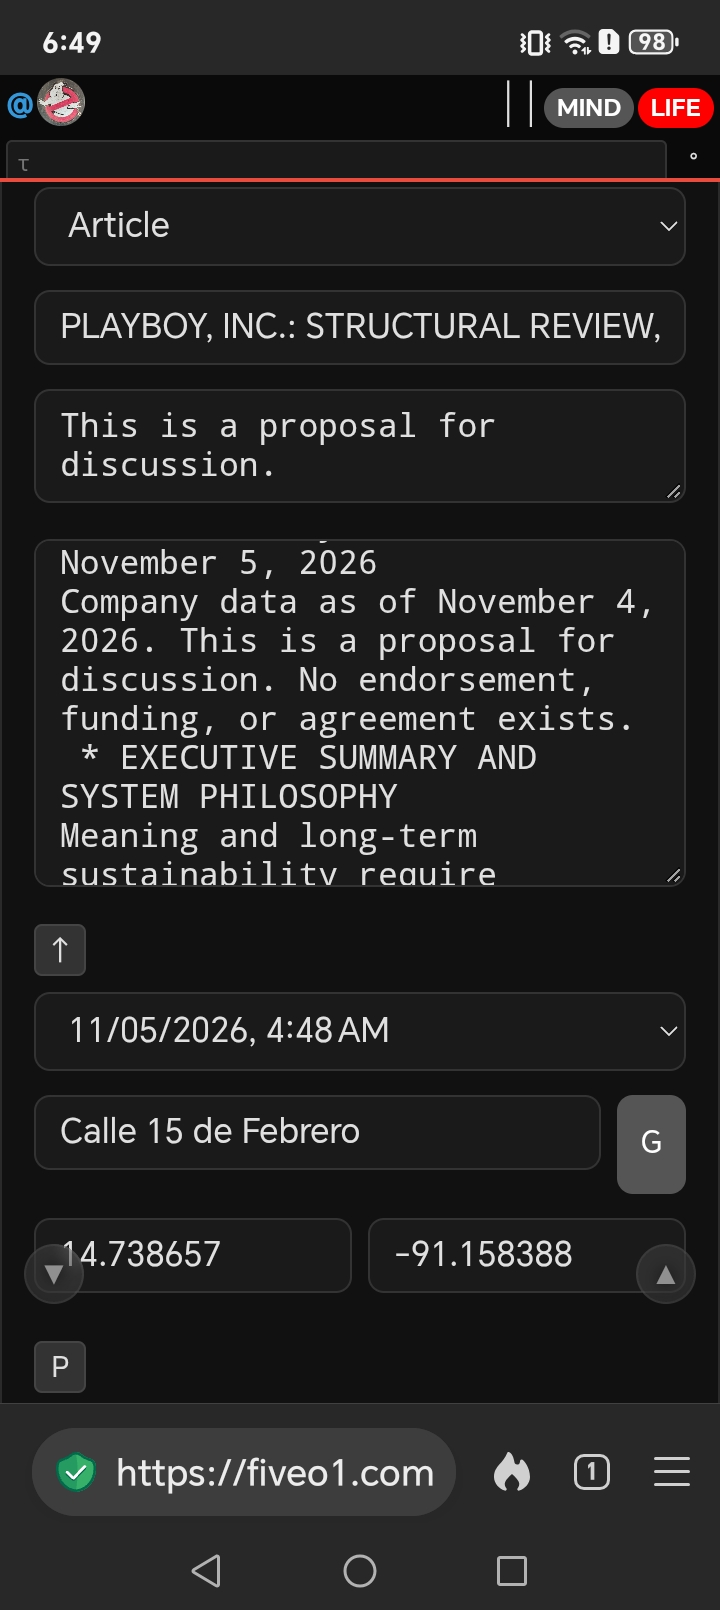
PLAYBOY, INC.: STRUCTURAL REVIEW, FIVEO1 REDEVELOPMENT PROPOSAL, AND SYSTEM ARCHITECTURAL Framework @2026-11-05 06:48:35 - Calle 15 de Febrero
Calle 15 de Febrero |
PLAYBOY, INC.: STRUCTURAL REVIEW, FIVEO1 REDEVELOPMENT PROPOSAL, AND SYSTEM ARCHITECTURAL FRAMEWORK
Prepared by Evan Winter, Fiveo1
District 69
PO Box 312786, Avalon, California 90704
Post mail only
November 5, 2026
Company data as of November 4, 2026. This is a proposal for discussion. No endorsement, funding, or agreement exists.
* EXECUTIVE SUMMARY AND SYSTEM PHILOSOPHY
Meaning and long-term sustainability require explicit structure. Data demands redundant off-site backups and embedded metadata; human attention requires protection from algorithmic extraction; capital demands coherent organizational hierarchy; history requires unalterable primary records; and structural enterprise evaluations require empirical grounding free from speculative hype.
This document integrates a comprehensive financial, operational, and structural analysis of Playboy, Inc. (NASDAQ: PLBY) with the technical framework and deployment architecture of Fiveo1. It evaluates Playboy's legacy corporate assets, identifies operational failure points in platform overhead, and details a phased redevelopment proposal utilizing Fiveo1’s high-uptime, low-overhead software stack.
* PLAYBOY, INC.: COMPANY AND MARKET POSITION
Playboy, Inc. (NASDAQ: PLBY), located in Los Angeles, California (formerly PLBY Group), operates as a global pleasure and leisure enterprise built around the Playboy brand and Honey Birdette lingerie. The company operates across three primary business segments: Direct-to-Consumer (Honey Birdette), Licensing, and Digital Subscriptions and Content. The company was added to the Russell 2000 and Russell 3000 indices in June 2026. Playboy pays no dividend.
Market Metrics (as of November 4, 2026):
* Share price: $1.39 at market close.
* Market capitalization: Approximately $164M to $166M.
* Three-year trading range: Low of $0.44 (November 2023) to high of $2.71 (February 2026).
* Year-to-date performance: Down approximately 37 percent from $1.88.
* Ownership profile: Insider ownership is estimated between 8 percent and 11 percent (with legacy figures reporting up to 34.5 percent); institutional ownership stands between 18 percent and 28 percent (with legacy estimates reaching 32.5 percent).
* Insider transactions: Insiders were net sellers over the preceding 3 months, disposing of approximately $3.1M in equity with zero open-market purchases.
* Analyst coverage: Three analysts maintain a Buy rating, with a consensus price target of $2.83.
* PROFIT AND LOSS ANALYSIS
FY2025 Financial Results:
* Total Revenue: $120.9M (an increase of 4.1 percent).
* Net Loss: $12.7M (EPS -$0.13).
* Operating Cash Flow: $0.02M.
* Free Cash Flow: -$1.0M.
* Operating Margin: -6.6 percent.
Q4 2025 Financial Results:
* Total Revenue: $34.9M.
* Net Income: $0.9M (EPS $0.03), matching market consensus.
Q1 2026 Financial Results:
* Total Revenue: $30.2M (an increase of 5 percent).
* Net Loss: $4.0M (EPS -$0.03), which included approximately $3.5M in UTG transaction costs. Consensus was $0.01 EPS, missing expectations on both revenue and earnings.
* Adjusted EBITDA: $5.0M (an increase of 111 percent), marking the fifth consecutive quarter of positive adjusted EBITDA.
* Operating Cash Flow: -$8.1M.
* Cash position declined from $37.9M to $30.3M during the quarter.
Q2 2026 Financial Results:
* Total Revenue: $31.2M (an increase of 10.9 percent).
* Net Income: Approximately $0.2M (roughly breakeven), compared to a net loss of $7.7M in Q2 2025.
* Operating Income: Approximately $3.0M.
* Adjusted EBITDA: $7.0M (22 percent margin), representing the sixth consecutive quarter of positive adjusted EBITDA.
* Operating Cash Flow: Positive $2.0M.
H1 2026 Totals and Outlook:
* H1 2026 Revenue: $61.5M (an increase of 8 percent).
* Q3 2026 Outlook: Results scheduled for release post-market close on November 5, 2026. Consensus estimates indicate EPS of $0.01 on revenue of approximately $30.3M.
* Full-Year FY2026 consensus EPS is approximately $0.00. The FY2027 estimate is $0.08.
* SEGMENT ANALYSIS AND OPERATING MARGINS
Honey Birdette (Core Growth Segment)
* Q2 2026 Revenue: $19.5M (an increase of 18 percent).
* Comparable Sales: Up 15 percent overall (retail stores up 13 percent, online up 16 percent).
* Store Performance: Seven consecutive quarters of double-digit store comparable sales growth.
* Q1 Gross Margin: 57 percent.
Licensing Segment
* Q2 2026 Revenue: $11.2M (an increase of 2.2 percent).
* Revenue Visibility: Approximately 91 percent of FY2026 licensing revenue is contractually guaranteed. Unrecognized future revenue under contract is officially reported at more than $320M (with quotes citing up to $333M).
* Strategic Brand Partners: Includes global licensing collaborations with Supreme and Missguided, alongside a major China licensing agreement executed in June 2026.
Group Margins and Structural Cost Friction
* Gross Margin: Consistently ranges between 70 percent and 73 percent (reaching 73 percent in Q2 2026).
* Operating Expense Overhead: Selling, General, and Administrative (SG&A) expenses absorbed approximately 75 percent of total FY2025 revenue, completely eroding gross profit and forcing negative operating margins.
* BALANCE SHEET, CAPITAL STRUCTURE, AND FINANCIAL EFFICIENCY
Balance Sheet Profile (as of June 30, 2026):
* Total Outstanding Debt: $144.9M, reduced from $159.9M at year-end 2025.
* Total Cash and Equivalents: $37.1M.
* Current Ratio: Approximately 1.0, leaving zero operational liquidity cushion.
* Pending Transactions: $37.0M in gross proceeds from the pending UTG transaction are earmarked for direct debt reduction.
* Equity Repurchase: In June 2026, the company agreed to repurchase approximately 16.6M shares (representing 15 percent of total outstanding equity) for approximately $17M, execution representing a 28 percent discount to market value.
* Debt Ratio: Total debt represents roughly 87 percent to 88 percent of market capitalization.
* Implied Enterprise Value: Market cap (~$164M–$166M) plus total debt ($144.9M) less cash ($37.1M) yields an enterprise value of approximately $271.8M to $273.8M, subject to debt classification nuances.
Capital Allocation Principles and Account Structure Efficiency:
Financial leverage mirrors physical systems engineering. Under Regulation T, initial margin requirements set a 50 percent equity threshold, while FINRA rules and firm-specific house rules enforce ongoing maintenance thresholds typically between 25 percent and 40 percent. Furthermore, FINRA rules mandate a $2,000 minimum equity threshold to open or maintain margin operations.
Splitting capital across multiple isolated accounts creates structural inefficiency: margin capabilities remain disabled, cash drag increases, and overall capital efficiency drops. Account consolidation above regulatory thresholds unlocks borrowing capacity and optimizes operational liquidity. However, this structure increases position concentration risk and subjects the capital structure to potential margin calls during market drawdowns.
For 529A-style or long-term growth accounts bound by strict equity mandates (such as a 100 percent U.S. equity rule with no bond glide path), historical data shows that U.S. equities have outperformed U.S. bonds by approximately 5.5 percentage points annually since 1926, generating a 10.7 percent annualized return compared to 9.1 percent for a 60/40 allocation over rolling 10-year periods. However, single-country equity mandates remove downside buffers, increase drawdown severity during macro shocks, and remove the portfolio variance benefits offered by cross-asset diversification.
* STRUCTURAL FAILURE POINTS AND RISK ASSESSMENT
Primary Corporate Vulnerabilities:
* Absence of Sustained GAAP Profitability: Trailing 12-month GAAP EPS stands at approximately $0.00.
* Extreme SG&A Erosion: Operational overhead consumes high gross margins (70–73 percent), keeping net margins thin or negative.
* High Debt Burden: Enterprise debt ($144.9M) remains high relative to market cap (~$164M–$166M), while a 1.0 current ratio limits flexibility.
* Cash Flow Volatility: History of negative free cash flow, including a -$8.1M operating cash outflow in Q1 2026.
* Strategic Instability: Legacy of shifting strategic focus and inconsistent platform execution; total revenue remains stagnant at ~$121M annually.
* Governance and Market Risks: Net insider selling ($3.1M sold vs. $0 bought over 3 months), lack of dividends, and total exposure to discretionary retail spending.
* Earnings Volatility: Q1 2026 missed consensus estimates on both EPS and revenue.
Counter-Evidence and Operational Strengths:
* Adjusted EBITDA Stability: Six consecutive quarters of positive adjusted EBITDA, reaching a trailing 12-month run-rate of approximately $28M (excluding litigation).
* Earnings Recovery: Q2 2026 delivered a return to GAAP profitability ($0.2M) and positive operating cash flow ($2.0M).
* Strong Core Assets: Sustained double-digit comparable growth at Honey Birdette, backed by over $320M in guaranteed licensing backlog.
* Active Balance Sheet De-leveraging: Debt reduced by $15M in H1 2026, with an additional $37M in UTG proceeds assigned to debt reduction.
Summary Assessment:
Playboy, Inc. is highly leveraged and operating with thin structural margins, but the underlying business shows tangible operational improvements rather than imminent insolvency. A formal proposal to the Board of Directors must address SG&A efficiency rather than assuming corporate collapse.
* UNVERIFIED METRICS AND INFORMATION GAPS
* Q3 2026 actual performance metrics (unreleased as of November 4, 2026).
* Exact full-year FY2026 financial metrics and active corporate headcount.
* Net debt and net cash figures following the final settlement of the UTG proceeds and share buyback execution.
* All future forward-looking targets, which rely on external analyst consensus rather than audited corporate guidance.
* TECHNICAL BACKGROUND: EVAN WINTER AND FIVEO1
Personal and Technical Background:
Evan Winter (born 1979) followed a self-directed technical path, beginning with hardware systems and programming at age 12. He expanded into design and publishing software (Photoshop, Illustrator, InDesign, Dreamweaver) by age 21, and subsequently mastered system administration, Linux environments, and security auditing (Kali Linux) through direct reverse-engineering and systems troubleshooting.
Technical Core Competencies:
* Languages and Web Stacks: PHP, JavaScript, HTML, CSS, Bash, SQL (MySQL, SQLite).
* Operations and Infrastructure: Linux server administration, Git version control, Apache web server configuration, custom web scrapers, application troubleshooting, network packet analysis, and penetration testing tools.
* Corporate Experience: Telemarketing, supplies account management, internal software application programming, and intranet architecture at Xerox Image Source. Principal consultant at New Start Technology, managing IT infrastructure for roughly 35 corporate clients. Supplemental experience spans freight/dock logistics, construction, medical office administration, marketing, and technology consulting.
* Community Service: Documented volunteer work including ~10 years with Youth Hope, ~15 years with Hands of Mercy (small-home construction in Baja California), ~6 years with Kiwanis, and ~15 years with Foster Family Network (overlapping periods).
* Global Logistics Context: Extensive field experience covering over 30 countries across Asia, Europe, the Middle East, North Africa, and the Americas.
Fiveo1 System Architectures:
* POT9 Application Platform: Browser-based multimedia capture engine collecting photos, video, geospatial coordinates, and precise timestamps into a searchable chronological record. Features native map-based journey plotting and public indexing via JSON-LD structured data.
* Enterprise Voting and Polling Engine: Secure voting framework built on PHP, SQLite, and vanilla JavaScript. Tracks device IDs, IP addresses, user-agent strings, and hardware signatures to deliver verified unique vote tallies vs. raw vote totals. Integrated with an official-representative directory.
* High-Availability Infrastructure Model: Hub-and-spoke virtual machine setup utilizing daily clone image recovery, active watchdog processes, and deterministic recovery time objectives (RTO).
* Enterprise Logistics Systems: Open-source maritime inventory tracking and financial reconciliation ledgers, recording unit-level acquisition costs, landed expenses, gross margins, and days-to-sale metrics.
* Physical Systems Research: Conceptual frameworks for biomimetic materials, amphibious transport craft, and semiconductor architecture.
* FIVEO1 REDEVELOPMENT PROPOSAL FOR PLAYBOY, INC.
Implementation Areas:
* Fan Engagement and Paid Voting: Deploy the Fiveo1 voting platform across digital properties. Logs device IDs and geographic locations to eliminate fraud and provide accurate unique-user voting counts for brand competitions.
* Digital Content and Subscription Infrastructure: Replace legacy media systems with Fiveo1’s POT9 capture and indexing engine, providing lightweight multimedia storage, structured map journeys, and native JSON-LD metadata for optimized search indexing.
* SG&A Overhead Reduction: Transition heavy enterprise software pipelines to Fiveo1’s lightweight PHP/SQLite VM stack. Standardized daily clone backups and automated recovery watchdogs reduce operational maintenance costs and lower platform SG&A overhead.
* Honey Birdette Retail Inventory Optimization: Implement Fiveo1’s unit-level inventory ledger across retail and e-commerce channels to track exact item acquisition costs, landed shipping fees, realized margins, and inventory turn days.
Phased Rollout Strategy:
* Phase 1: Comprehensive audit of legacy digital platforms and infrastructure costs.
* Phase 2: Controlled pilot deployment on select non-critical digital properties to validate performance metrics.
* Phase 3: Scaled migration only after the pilot meets explicit cost-reduction and uptime targets. Platform performance, processing latency, and storage efficiency must be benchmarked on production hardware prior to enterprise-wide rollout.
* ACQUISITION STRUCTURE AND REQUIRED NEXT STEPS
Valuation Metrics:
* Current Market Capitalization: ~$164.0M–$166.0M
* Plus Total Debt: +$144.9M
* Less Cash Balance: -$37.1M
* Implied Enterprise Value (EV): ~$271.8M–$273.8M
Financial and Governance Requirements:
* Capitalization Plan: Fiveo1’s documented POT9 core funding allocation is $264,000. No institutional underwriting partner or licensed lending syndicate has been formally contracted.
* Pre-Acquisition Requirements:
* Binding commitments from licensed lending institutions and accredited investors under SEC compliance.
* Formal approvals from the Playboy, Inc. Board of Directors and shareholders (noting insider equity holdings).
* Analysis of Q3 2026 earnings results and mutual due diligence.
* DIGITIZATION, ARCHIVAL SCIENCE, AND OBSERVATIONAL ARCHITECTURE
The Fragility of Modern Media and the 3-2-1 Rule:
Digital records are inherently fragile. Cloud platforms alter terms, hard drives suffer bit rot, solid-state drives lose charge when unpowered, and proprietary file formats become obsolete. File management requires active curation rather than passive accumulation.
Digital archives must adhere to the 3-2-1 Backup Rule:
* 3 total copies of all vital records.
* 2 different storage media types (e.g., local NVMe/SATA storage + optical/LTO tape or cold cloud).
* 1 copy stored in a secure off-site geographic location.
File formats should prioritize open standards: JPEG, TIFF, or DNG for static imagery; MP4 (H.264/H.265) for video; WAV or FLAC for uncompressed audio; PDF/A, plain text, or Markdown for documents. Directory structures should maintain strict standardized naming conventions (e.g., YYYY-MM-DD_Location_Subject).
Engagement vs. Observational Software Frameworks:
Monetized digital platforms rely on engagement models—using infinite scroll, real-time push notifications, and algorithmic feeds to extract user attention for advertising revenue.
In contrast, Fiveo1 builds on an observational framework. Software tools should serve as quiet recording instruments without likes, public follower metrics, algorithmic feeds, or social validation loops. The user remains the author rather than the product, focusing on documenting real-world observation rather than chasing platform engagement.
* PHYSICAL AND GEOGRAPHIC CONTEXT NOTEBOOK
Field Archival and Primary Evidence:
During crises or active conflicts—such as the missile and drone strikes across Ukraine—primary documentation provides essential historical evidence. High-resolution imagery, exact timestamps, satellite context, and GPS coordinates preserve civilian experiences and infrastructural impacts independently of conflicting official accounts.
Physical Inspection Boundaries:
Visual inspection of physical samples provides basic structural data but cannot verify chemical safety or composition. For instance, visual review of dried cannabis flower can evaluate color (olive/brown), flower density, stem ratios, trim quality, and estimated moisture (8–10 percent). However, visual inspection alone cannot measure cannabinoid potency (THC/CBD percentages), terpene profiles, or the presence of microscopic mold, heavy metals, or chemical pesticides. Verified safety and potency determination requires certified laboratory testing.
Legal and Field Awareness (Central La Ceiba, Honduras):
Legal frameworks dictate local operational boundaries. In Honduras, cannabis possession, cultivation, and distribution remain illegal under national drug control laws, carrying criminal penalties. In central urban environments like La Ceiba—located south of the Caribbean waterfront near Estadio Municipal Ceibeño and Iglesia San José—situational awareness requires strict compliance with local laws, awareness of heavy security presence around transit hubs (intercity bus terminals and Utila/Roatán ferry docks), and practical safety measures in public areas.
* PROPOSAL CONTACT AND DIRECTORY
Principal Investigator:
Evan Winter
Fiveo1
District 69
PO Box 312786
Avalon, California 90704
Mail Communication Only ← All Articles← Home